Platform

Data Quality & Observability

Detect anomalies anywhere in your data, in real time

Lineage

Get to the root cause and resolve issues quickly

Data asset insights

Discover data assets and understand how they are used

Discover the product for yourself

Take a tour
CustomersPricing

Learn more

Customer stories

Hear why customers choose Validio

Blog

Data news and feature updates

Reports & guides

The latest whitepapers, reports and guides

Events & webinars

Upcoming events and webinars, and past recordings

Heroes of Data

Join Heroes of Data - by the data community, for the data community

Data maturity quiz

Take the test to find out what your data maturity score is

Get help & Get started

Dema uses Validio to ensure the data quality for their prescriptive analytics

Watch the video
Product Updates

Adapting fast & slow: tailoring dynamic thresholds with adaption rate

April 9, 2025
Oliver GindeleOliver Gindele

Getting the most out of automated anomaly detection often means fine-tuning how the system learns from your data. While Validio excels at automatically identifying outliers, understanding the nuances of your data's behavior allows for even more precise monitoring. That's why we've introduced the Adaption Rate setting for our Dynamic Thresholds, giving you greater control over how our anomaly detection bounds respond to changes in your data.

🚩 TABLE OF CONTENTS

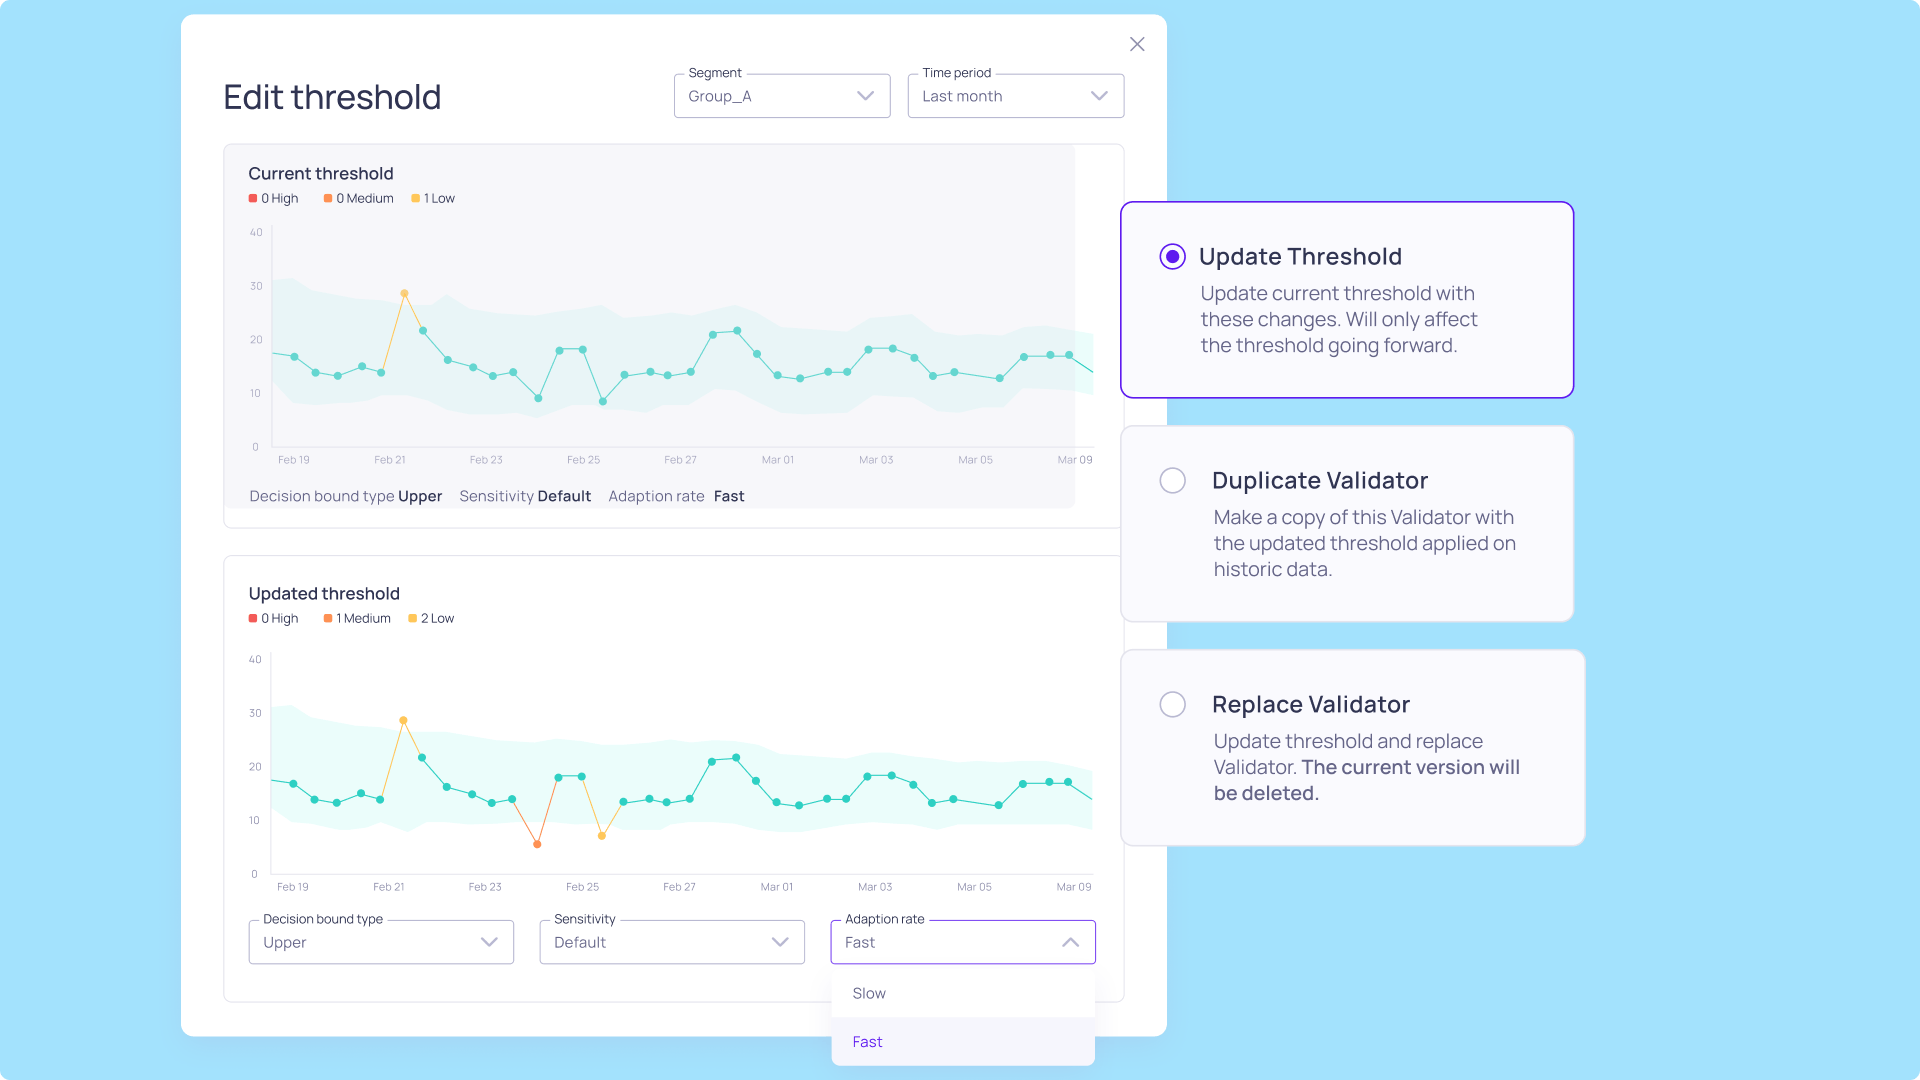
→ What are dynamic thresholds?

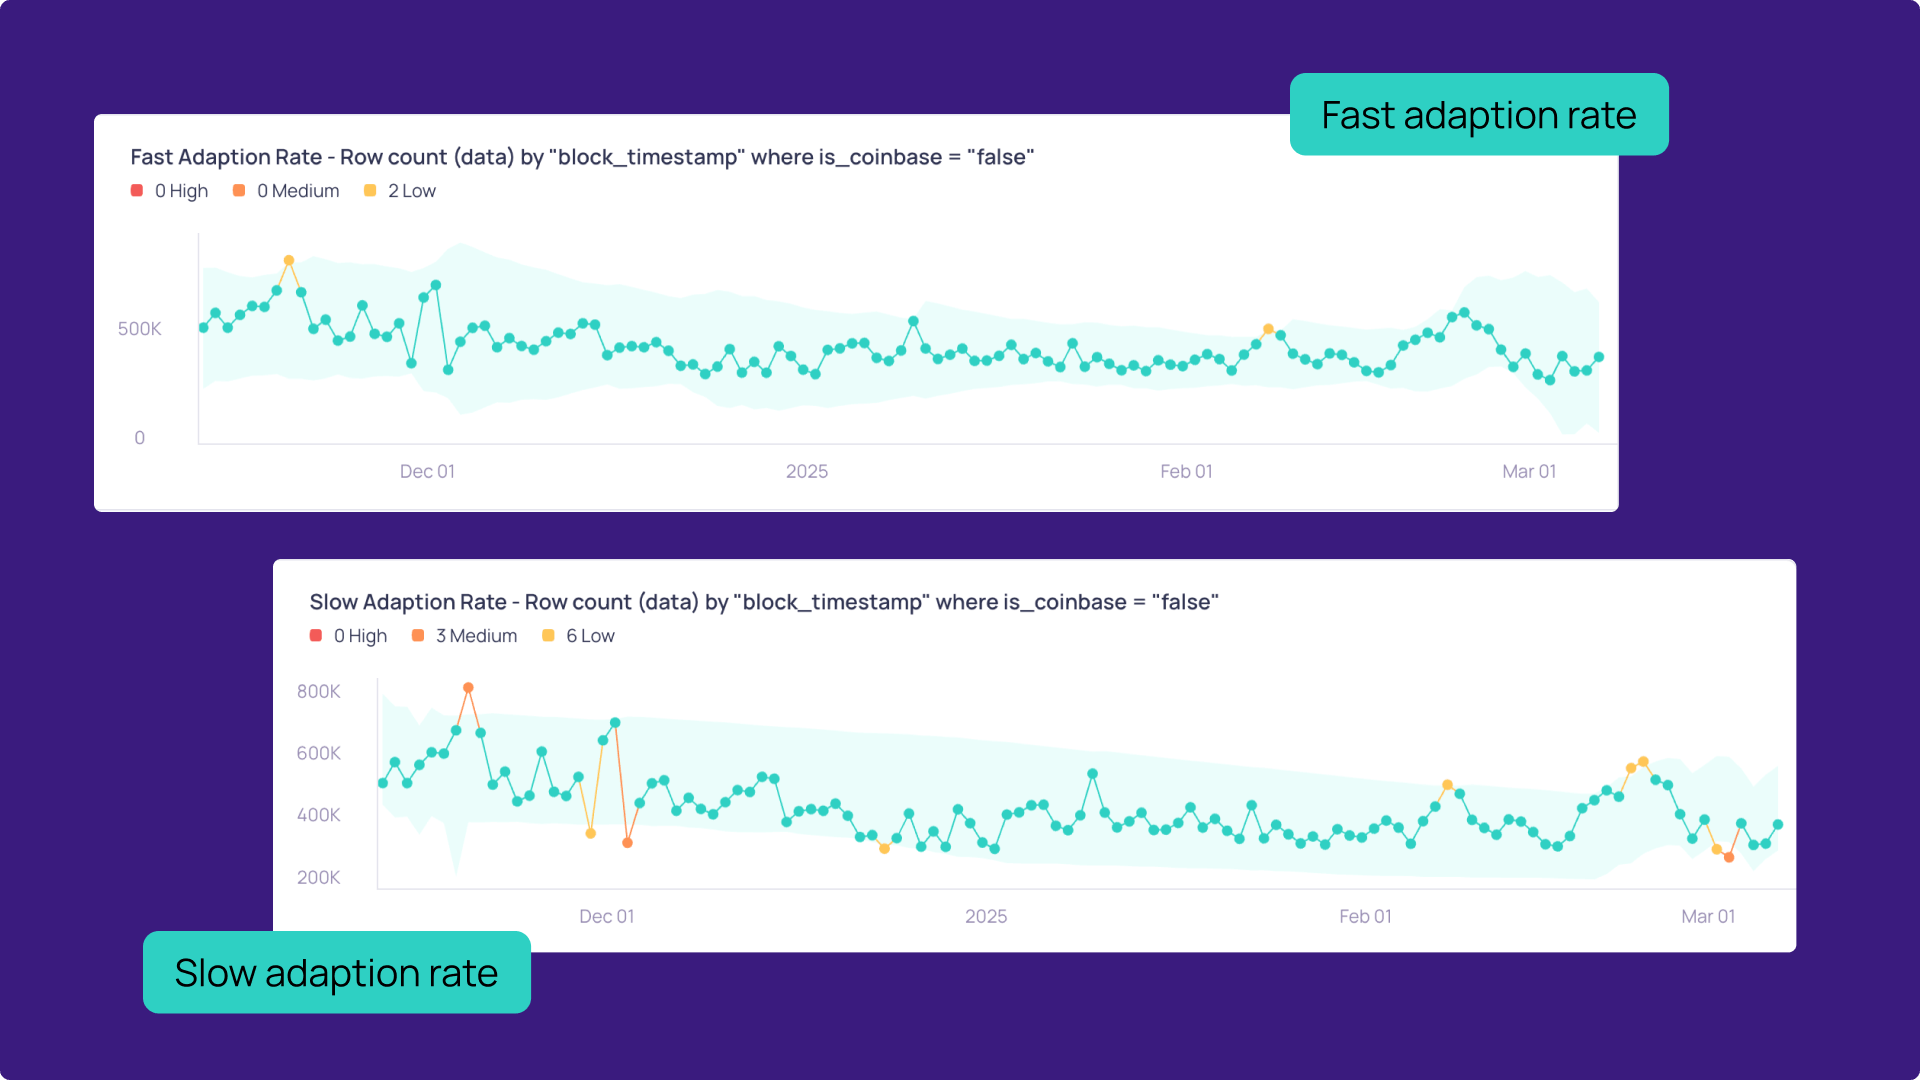
→ Understanding adaption rates: fast vs slow

→ Seeing the difference

→ So, when to use which adaption rate?

→ It's all about balancing automation and control

What are dynamic thresholds?

Thresholds are used to define whether certain data points are anomalous or not. When a validator detects data that breaches a defined threshold, it creates an incident to inform that a data quality issue, or metric anomaly, has occurred. There are three types of thresholds that can be used in Validio:

  1. Fixed Threshold: Triggers an alert when a metric crosses a set value you define. For example, check that no entries in the "Age" field are less than zero.
  2. Dynamic Threshold: Automatically sets thresholds based on data patterns. You can fine-tune how sensitive they are and how fast they adapt (more on this in this blog post). For instance, monitor daily average sales to detect unusual spikes or drops.
  3. Difference Threshold: Detects sudden changes over time by comparing a metric across time windows. For example, get notified if a value drops by a certain percentage two days in a row.

Dynamic Thresholds are powerful because they learn what's "normal" for your data over time. But how quickly should they adapt when patterns shift? That's where the Adaption Rate comes in.

Understanding adaption rate: Fast vs. Slow

You can now configure how rapidly the dynamic threshold model adjusts to new data trends:

Fast:

What it does: The model reacts quickly to changes. If a new trend emerges or data becomes more volatile, the "normal" bounds adjust swiftly.

Best for: Metrics that naturally change often (like social media engagement or volatile market data), or when monitoring a brand new data source where you want the system to learn the patterns rapidly without triggering excessive initial alerts. This setting mirrors the previous default behavior of Validio's dynamic thresholds.

Slow:

What it does: The model adjusts more gradually, giving more weight to historical data. It still adapts, but over a longer timeframe.

Best for: More stable metrics where you want to ignore short-term noise but still catch significant outliers or shifts (like weekly conversion rates). It's also effective for metrics with slow, consistent trends (like monthly user growth), as it helps identify when that trend breaks.

Seeing the difference

The impact becomes clear when visualized. With Fast Adaption, the threshold bounds tend to hug the recent data points more closely, rapidly widening or narrowing as data shifts. With Slow Adaption, the bounds are smoother and more persistent. They follow established trends more steadily, making deviations from that trend (like the upward swing at the end of February) more likely to trigger alerts.

So, when to use which adaption rate?

Selecting the right Adaption Rate depends heavily on your specific data and what you consider an important deviation:

  • Volatile metrics (e.g., stock prices, social media engagement): Use Fast. You need the threshold to keep pace with frequent, genuine shifts to avoid stale bounds and false alerts.
  • Stable metrics with occasional spikes (e.g., conversion rates, error counts): Use Slow. This minimizes the influence of temporary noise or short-lived anomalies, ensuring you're alerted primarily to significant, sustained deviations.
  • Metrics with gradual trends (e.g., monthly sales, user growth, row counts): Use Slow. The emphasis on historical data helps maintain the established trendline, making it effective at flagging when the data departs from that expected trend.
  • New data sources: Start with Fast. This allows the model to quickly establish initial patterns and adapt as it learns the data's behavior, reducing noise during the initial monitoring phase.

Imagine you monitor how often customer payments fail. You offer several ways to pay (like Visa, PayPal, etc.) and various checkout options. Usually, failure rates are low and stable, but sometimes, they might spike briefly. You need to know if there is a real problem causing a sharp, sustained increase in failures for a specific payment method.

In this case, using the slow adaption rate and Validio’s Segmentation feature is ideal. It learns the usual low failure rate for each segment (like Visa's base rate vs. PayPal's base rate) and doesn't overreact to small, temporary fluctuations. This way, if failures suddenly jump up significantly for one method, Validio will alert you, and you will know immediately that the issue is specifically within a specific segment.

It's all about balancing automation and control

The introduction of the Adaption Rate highlights an often ignored aspect of modern data quality monitoring: the need for both intelligent automation and user-driven configuration. Algorithms provide the power to detect patterns and anomalies at scale, but the sheer diversity of data means a one-size-fits-all approach is rarely enough.

Parameters like the Adaption Rate act as levers, allowing you to fine-tune the behavior of these algorithms to match the unique characteristics of your business’s specific data. Every dataset tells a different story, influenced by distinct business cycles, external events, and operational nuances. 

At Validio, we are working hard to strike the right balance: We aim to provide sophisticated monitoring capabilities that work effectively "out of the box," yet we recognize the need for control. Features like the Adaption Rate empower users to tailor the platform's intelligence, ensuring that the insights and alerts generated are not just statistically meaningful but truly relevant to their specific context and monitoring goals. It's about providing the right tools to turn anomaly detection to build actual data confidence.

Read more:

Dynamic thresholds for precise anomaly detection

Read the blog post